
Not all data is created equal!
NUMEN produces a high-quality, AI ready, energy dataset like no other

Numen’s data acquisition system uses non-intrusive clip-on current transformers which are installed at the electrical distribution board.
In addition to the Numen Current Transformers, Numen can also collect data from existing systems via other communication protocols such as Modbus.
The system is designed to be easy to install by any qualified electrician and can often be installed without shutting down the power.
Components
Numen Collector
The Numen Collector is at the heart of the Numen systems.
Data is collected from the electrical devices with the Numen Collector. The Collector is connected to the wiring via split-core current transformers (see below) and directly connected voltage reference.
In addition to high-resolution data acquisition, the Collector also provides a computing platform capable of executing complex machine learning algorithms in real-time.
Numen hardware is certified for operation in Data Centres.
SPEC SHEET
Numen Collector
The Numen Collector is at the heart of the Numen systems.
In addition to high-resolution data acquisition, the Collector also provides a computing platform capable of executing complex machine learning algorithms in real-time.
Power Supply
Supply Voltage
100-240 VAC, 50/60Hz (3 phase/single phase supplied to L1)
Power Consumption
20W (max. 0.22A)
Physical properties
Dimensions
200mm x 120mm x 35mm (approx. 7.9in x 4.7in x 1.4in)
Weight
Approx. 500g (1.1 pounds)
IP Rating
IP20
Flammability Rating
UL64-V0
Mounting
Din rail
Max. Ambient Temp
50°C (122°F)
Installation
Indoors, dry location
Data Acquisition, Storage and Upload
Channels
12 total, 3 voltage, 9 current
Sampling Rate
8,000-256,000 samples per second (default: 8,000)
Resolution
16 bit
Internal Data Storage
16GB (~2 weeks data), optional up to 256GB SD Card (>6 months data storage
Time Keeping
NTP synchronised real-time clock
Upload Data Resolution
1 sec - 15 mins (default: 30 secs)
Data Upload Interval
1min - 1 hour (default: 10 mins)
Data Connectivity
WiFi - 2.4/5GHz 802.11 a/b/g/n/ac
Current Transformers
Split-core, clip on
50A, 100A, 200A, 300A, 400A, 500A, 1000A Rogowski
Reported Data Parameters
Basic Electrical
RMS Current (min, avg, max) — A
RMS Voltage, line-to-neutral (min, avg, max) — V
Real Power (min, avg, max) — kW
Apparent Power (min, avg, max) — kVA
Reactive Power (min, avg, max) — kVAr
Power Factor (min, avg, max)
Frequency Components
K Factor
Total Harmonic Distortion, Current (min, avg, max) — %A of fundamental
Total Harmonic Distortion, Voltage (min, avg, max) — %V of fundamental
@8,000 samples per second — first 80 significant harmonics
@256,000 samples per second — first 100 significant harmonics
Data Acquisition, Storage and Upload
Radio
EN 300 328 V2.1.1:2016
EN 301 893 V2.1.1:2017
EMC
EN 301 489-1 V2.1.1:2017
EN 301 489-17 V3.1.1:2017
EN 61326-1:2013
EMF
EN 62311:2008
Safety
EN 61010-1:2010


Numen Gateway
The function of the Numen Gateway is to transport data from the Collectors, installed in buildings, to the cloud-based Data Engine.
The Numen Gateway creates secure, independent Internet access points. The Gateway is plug-and-play and requires no configuration.
SPEC SHEET
Numen Gateway
The function of the Numen Gateway is to transport data from the Collectors, installed in buildings, to the cloud-based Data Engine. The Numen Gateway devices creates an independent wireless network access point for Collectors and provides a connection to the cloud via mobile and/or local area networks.
Power Supply
Supply Voltage
100—240VAC, 50/60Hz, Power Over Ethernet
Power Consumption
17W
Physical properties
WiFi
802.11 a/n/c
Ethernet
1x10/100/1000 Ethernet Port
Fibre
1x SFP DDMI
USB
1x Type A
3G/4G SIM Card
Mini Sim
Numen Current Transformers
Accurate data collection starts with the quality of the sensor, and in the case of Numen, this is the Numen Current Transformer.
Current transformers not only have to produce accurate data, but they must also be robust and easy to install. Errors during installation are the main cause of inaccurate readings and often require additional site visits, which dramatically increases the cost of installation.
Current Range: 50 - 1000 A


Data Engine
The data recorded by the Numen Collectors is transported to the cloud-based Numen Data Engine.
The Data Engine is capable of securely storing and processing vast volumes of data.
Once the data is in the cloud, it is analysed and processed with an ever-increasing collection of machine learning algorithms to produce automated, natural-language reports, recommendations and event notifications.

Numen data engine

Direct data access

Numen interfaces
User Console
The Numen Console is the primary way to interact with the Numen system. The Console provides a central location to find all reports, recommendations, events as well as data analysis tools that make it easy to gain an understanding of what the data means for your data centre. The console has three main areas:
1. Visualisation Analyse and compare historical data
The Numen Web Console provides a variety of data visualisation and analysis tools to access the rich dataset that Numen records.
It makes it easy to compare different devices and overlay different parameters. Drill down into the detail data that is recorded by Numen and bookmark significant events. Find failure root causes and circumstances leading up to failures.
Data can also be exported for further analysis in other applications.
Maximun Data Resolution: 10 seconds
Minimum Data Retention: Time: 1 Year


2. Insights Understand what the data means
Reporting provides standard and custom reports that provide insight into your systems.
Arc detection
Numen can detect the presence of electrical arching. The screenshot left shows the presence of arcing on a circuit.
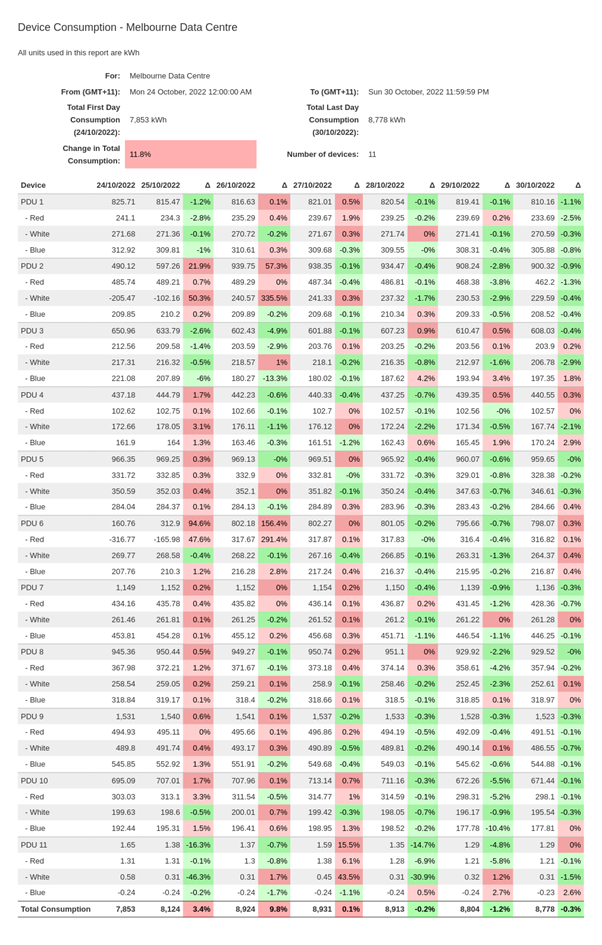
Click here to review a typical custom report. This is a Power Usage Efficiency report showing increases (red) and declines (green) in PUE of specific equipment. In this case computer racks in a data centre.
3. Notifications
Provide a central location to see all notifications related to the status of your system.
Notification screen provides a filtered list of notifications for a specific device. This allows deep analysis of event occurrences.


